
Reading the Ground: Micro‑Terrain Revealed in 3D
Tiny Landforms, Big Insights beside the Path
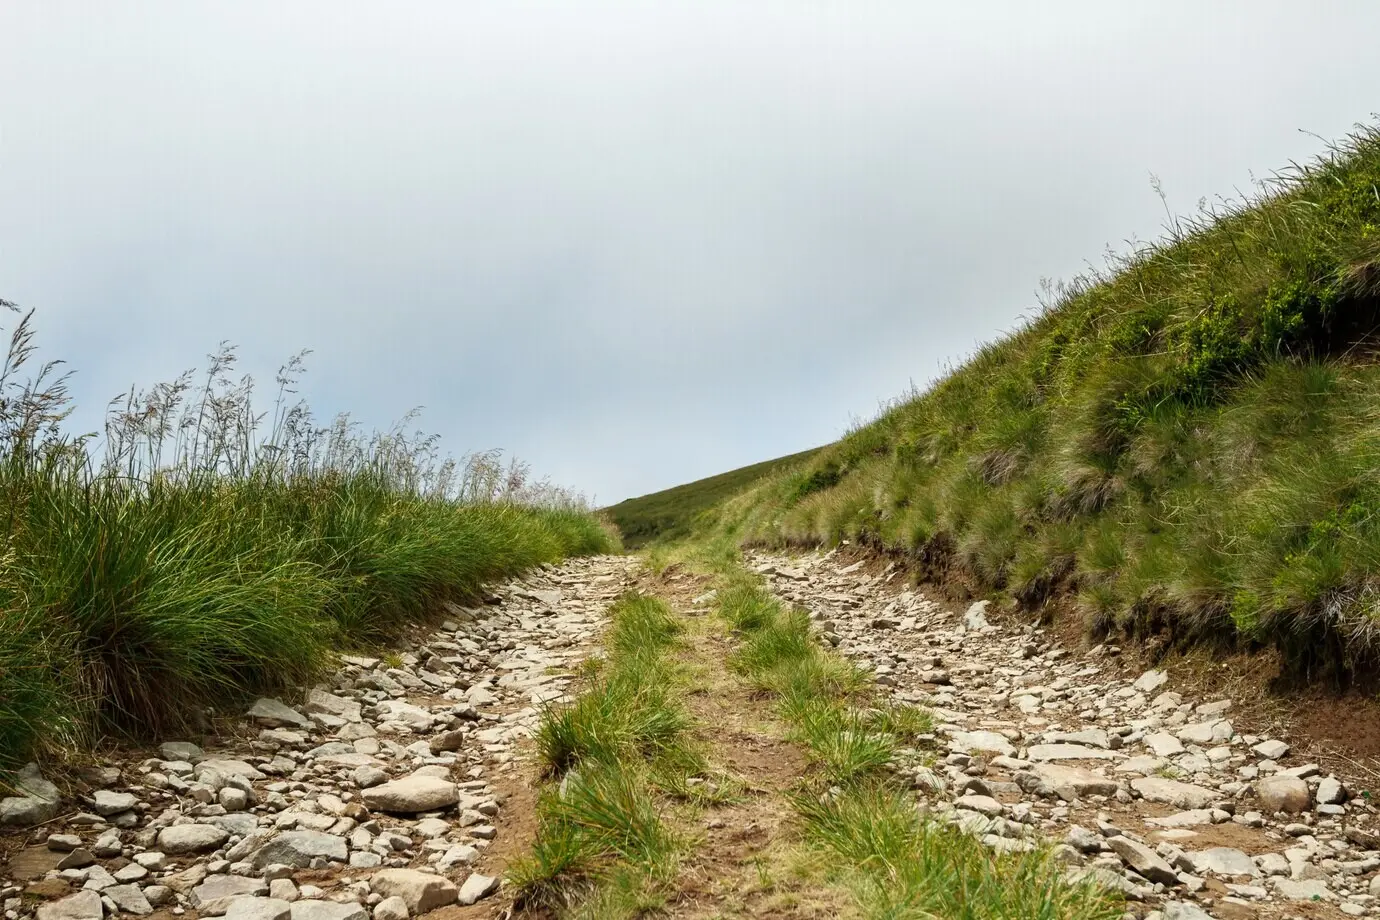
Erosion fingerprints you can finally measure
Microhabitats for seeds, moss, and invertebrates
Light like a softbox from the sky
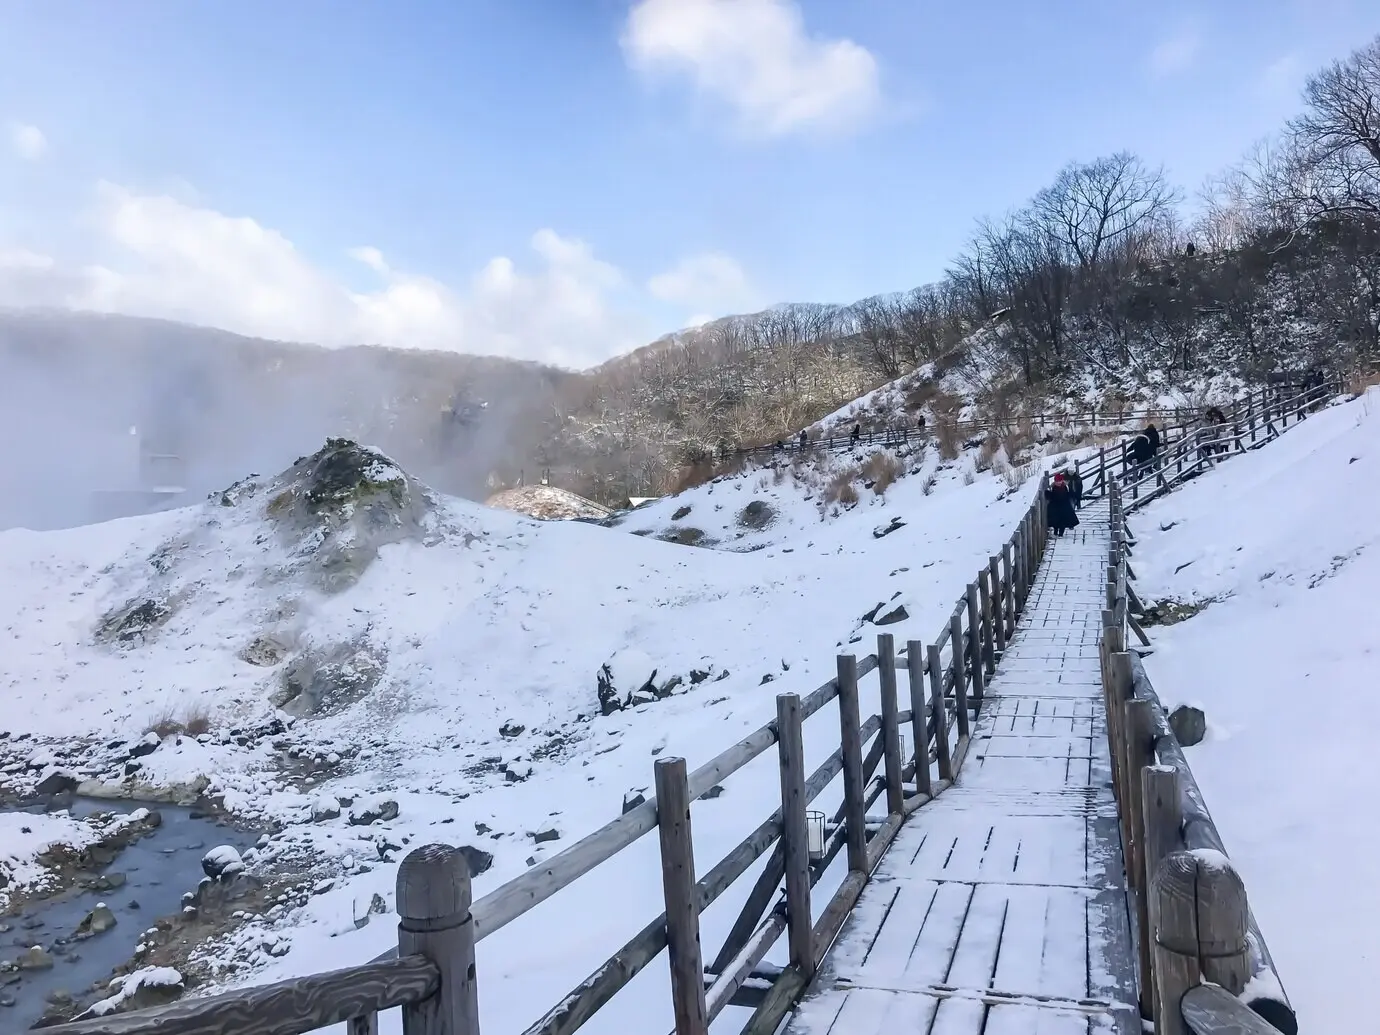
Anchors, scales, and check points at ground level
Stability and spacing that tame parallax


Optics, Sensors, and Capture Settings
Macro photogrammetry when budgets are lean

Structured‑light scanners for sub‑millimeter edges
LiDAR’s strengths and limits at centimeter scales
From Images to Models: Processing and Quality Assurance

Derivatives that make patterns obvious
Multi‑directional hillshade uncovers rills hidden in single‑source light. Slope and planform curvature map where water speeds up or slows down, predicting scour and deposition. Roughness indices isolate trampling scars from naturally armored surfaces. We pair these with orthomosaics for context and short callouts that highlight critical transitions. By simplifying outputs into clear visual stories, we help decision‑makers act quickly while preserving access to underlying metrics for those who need deeper, reproducible evidence behind every color ramp.
Quantifying change with confidence
DEM of Difference and point‑to‑mesh distances—like M3C2—translate intuition into measurable gain or loss. We register repeat surveys with robust constraints, then propagate uncertainty so maps display significance, not just magnitude. After a drainage tweak, one site showed measurable aggradation in previously scoured micro‑pockets, validating a modest intervention. Another revealed hidden undercutting beside a log step. Publishing not only results but also thresholds and confidence builds credibility, preventing overclaiming while still celebrating genuinely positive, documented improvements.
Communicating results to hikers and managers
Beautiful doesn’t mean confusing. We use simple legends, clear annotations, and viewer links that work on phones in the parking lot. Captions explain why a tiny ridge matters for seedlings or runoff, inviting stewardship rather than blame. For accessibility, we add alt text and keyboard navigation notes. We encourage subscribers to share comparable patches, submit questions, and vote on upcoming field trials. Engagement keeps techniques grounded, ensuring the next survey answers real worries voiced on last weekend’s walk.
All Rights Reserved.